Key Points
Apple generates consistently higher total revenue, though Microsoft demonstrates a smoother upward trajectory.
Apple exhibits recurring quarter-over-quarter volatility, whereas Microsoft shows steady, incremental growth.
Investors should watch whether the revenue gap between the two companies widens during seasonal peaks or narrows during quieter periods.
- 10 stocks we like better than Microsoft ›
Apple (NASDAQ:AAPL) is a far bigger business than Microsoft (NASDAQ:MSFT), but that may not make it the better investment.
Apple’s quarterly revenue is far ahead of Microsoft’s, but it’s not the size of these companies that will dictate future returns. It’s how fast they are growing and what that says about their addressable market.
Microsoft: Delivering Consistent Revenue Growth
Microsoft develops, licenses, and supports software, cloud services, and devices worldwide. It recently reported strong fiscal second-quarter results and amended its hosting agreement with OpenAI. It reported net income of $38.5 billion for the quarter ended Dec. 31, 2025.
Apple: Managing Recurring Revenue Cycles
Apple designs, manufactures, and markets smartphones, personal computers, tablets, wearables, and related services globally.
It announced an expansion of its hardware manufacturing operations in Texas and posted $42 billion in net income for the quarter ended Dec. 27, 2025.
Why Revenue Matters for Retail Investors
Revenue is the most fundamental metric to measure a company’s performance over time. Change over time indicates how easily a company can market its products and expand operations without meeting much resistance from competitors or a limited growth ceiling.
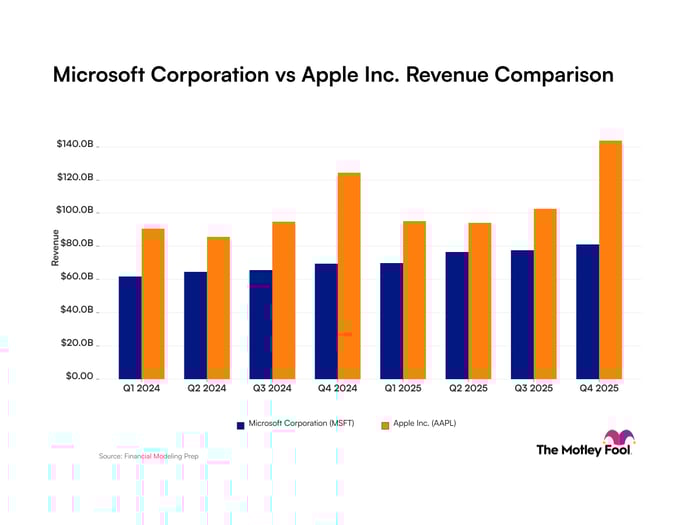
Quarterly Revenue for Microsoft and Apple
| Quarter (Period End) | Microsoft Revenue | Apple Revenue |
|---|---|---|
| Q1 2024 | $61.9 billion (period ended March 2024) | $90.8 billion (period ended March 2024) |
| Q2 2024 | $64.7 billion (period ended June 2024) | $85.8 billion (period ended June 2024) |
| Q3 2024 | $65.6 billion (period ended Sept. 2024) | $94.9 billion (period ended Sept. 2024) |
| Q4 2024 | $69.6 billion (period ended Dec. 2024) | $124.3 billion (period ended Dec. 2024) |
| Q1 2025 | $70.1 billion (period ended March 2025) | $95.4 billion (period ended March 2025) |
| Q2 2025 | $76.4 billion (period ended June 2025) | $94.0 billion (period ended June 2025) |
| Q3 2025 | $77.7 billion (period ended Sept. 2025) | $102.5 billion (period ended Sept. 2025) |
| Q4 2025 | $81.3 billion (period ended Dec. 2025) | $143.8 billion (period ended Dec. 2025) |
Data source: Company filings. Data as of April 28, 2026.
Foolish Take
Microsoft and Apple are competitors, but their financial results show they are fundamentally different businesses. Microsoft is focused on selling cloud and software products, while Apple primarily wants to put devices in people’s hands.
Microsoft’s trailing-12-month revenue has increased 44% over the last three years. The Microsoft Azure enterprise platform is riding strong demand for artificial intelligence (AI) services. Total cloud revenue grew 26% year over year last quarter to $51 billion, with Azure revenue alone up 39%.
Meanwhile, Apple has increased its trailing-12-month revenue by about 13% over the last three years. iPhone revenue grew just 6% year over year last quarter — its biggest source of revenue. Apple is relying more on its customers’ spending on extra services to pad its top- and bottom-line growth.
Investors will want to watch if Microsoft continues to grow faster and closes the gap with Apple. If it does, that could lead its stock to marginally outperform Apple’s from here.
Should you buy stock in Microsoft right now?
Before you buy stock in Microsoft, consider this:
The Motley Fool Stock Advisor analyst team just identified what they believe are the 10 best stocks for investors to buy now… and Microsoft wasn’t one of them. The 10 stocks that made the cut could produce monster returns in the coming years.
Consider when Netflix made this list on December 17, 2004… if you invested $1,000 at the time of our recommendation, you’d have $492,752!* Or when Nvidia made this list on April 15, 2005… if you invested $1,000 at the time of our recommendation, you’d have $1,327,935!*
Now, it’s worth noting Stock Advisor’s total average return is 991% — a market-crushing outperformance compared to 201% for the S&P 500. Don’t miss the latest top 10 list, available with Stock Advisor, and join an investing community built by individual investors for individual investors.
*Stock Advisor returns as of April 28, 2026.
John Ballard has no position in any of the stocks mentioned. The Motley Fool has positions in and recommends Apple and Microsoft. The Motley Fool has a disclosure policy.
5 Stocks Our Experts Predict Could Double In the Next Year
By submitting your email, you'll also get a free pivot & flow membership. A free daily market overview. You can unsubscribe at any time.