Key Index Performance
Most major indices, aside from the Russell 2000 ($IWM), are hovering near all-time highs as we begin the year 2024. The S&P and Nasdaq are particularly noteworthy, with potential for double tops on their monthly charts.
S&P 500-Monthly Chart
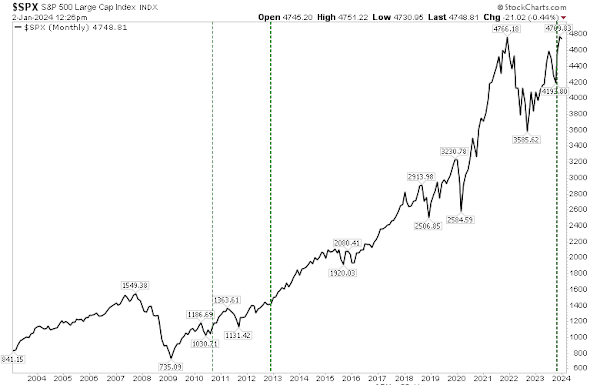
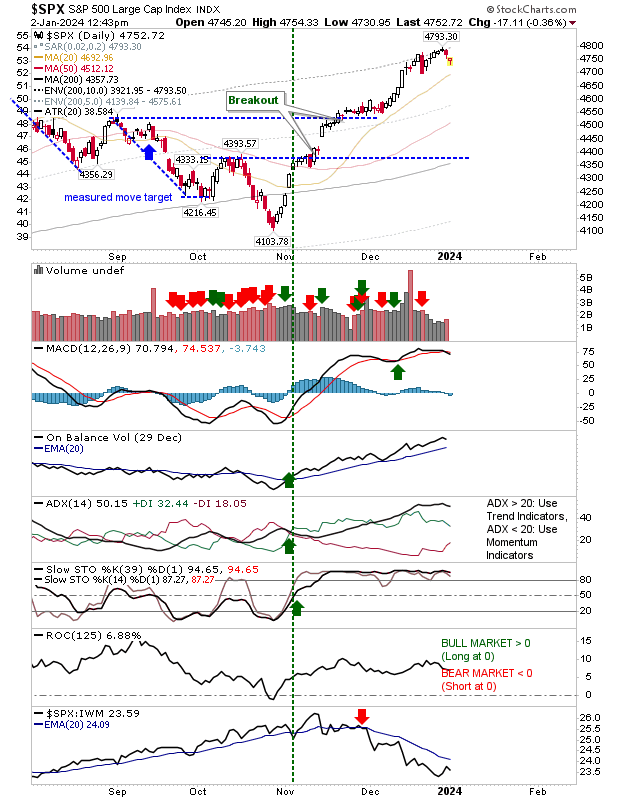
If the 2021 high is surpassed in the coming weeks, the risk of a double top diminishes. Despite this, substantial profit-taking from the October rally has yet to occur. Observers emphasize the importance of monitoring the 50-day moving average for potential buying opportunities as 2024 progresses.
S&P 500-Daily Chart
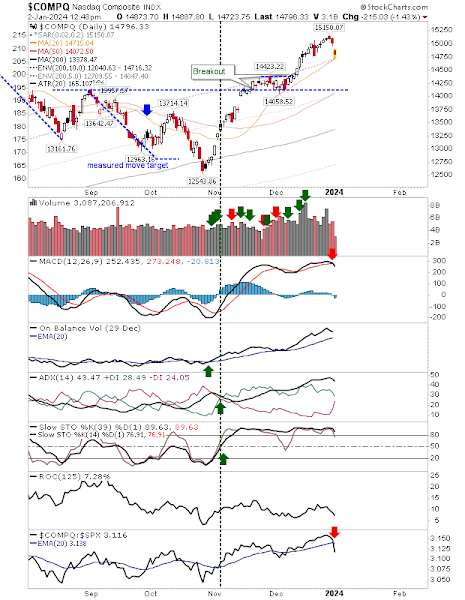
While the Nasdaq has not extended itself to the same extent as the S&P, there remains pent-up demand, which could be triggered by attempts to control the index’s activity. The MACD indicates a ‘sell,’ but other technical indicators remain healthy, and selling volume is notably lower in comparison to recent buying.
Nasdaq Composite-Daily Chart
The Russell 2000 ($IWM) has yet to reach 2021 highs, but end-of-year developments, such as a ‘golden cross’ between the 50-day and 200-day moving averages, signify a trend reversal in favor of bullish sentiment. Technicals signal strength, and selling volume has been minimal compared to buying activity seen in recent times.
IWM-Daily Chart
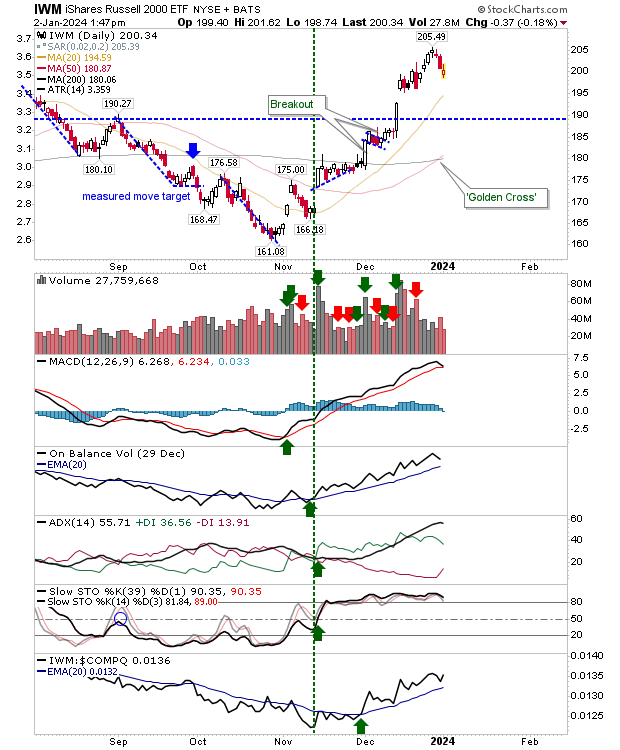
Looking ahead, the goal is to sustain the October trend, but not before allowing ‘weak hands’ to take their profits. The Russell 2000 ($IWM) presents an appealing prospect for attracting buyers as a “value” index compared to the S&P and Nasdaq. The following week will provide a clearer picture as traders return in full force.
5 Stocks Our Experts Predict Could Double In the Next Year
By submitting your email, you'll also get a free pivot & flow membership. A free daily market overview. You can unsubscribe at any time.