The Intriguing Ascending Triangle of Boeing
The Boeing Company BA reported earnings that fell short of estimates. Surprisingly, the stock surged post-earnings, prompting speculation about its future trajectory.
Decoding Chart Patterns and Investor Sentiment
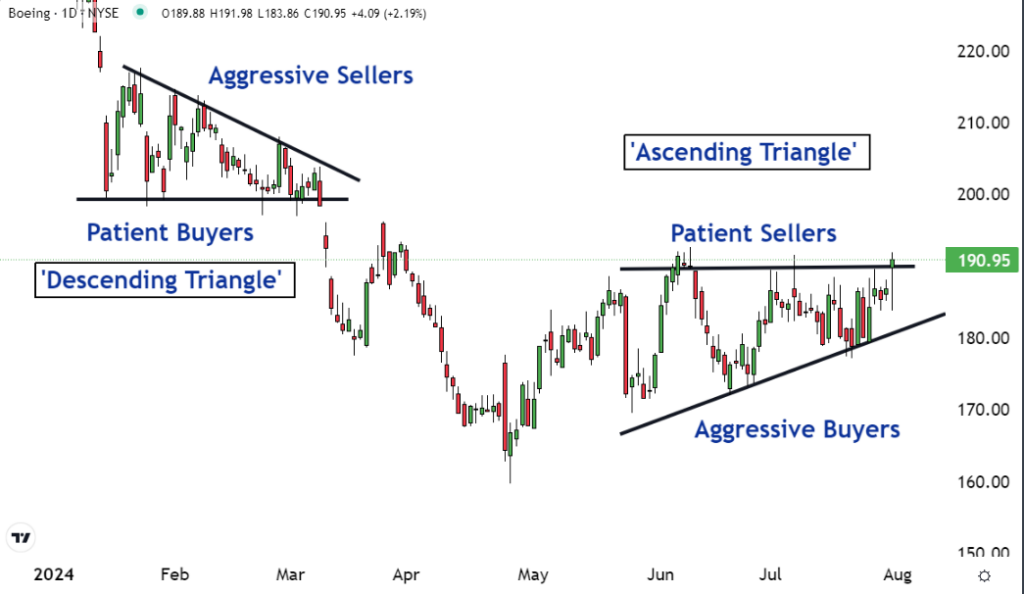
Chart patterns serve as visual representations of market sentiment and psychology. The ‘Ascending Triangle’ pattern observed in Boeing’s chart points to a bullish outlook. It reflects a scenario where buyers are progressively willing to pay higher prices, evident from the ascending support line.
Market movements are cyclical, characterized by peaks and valleys. The formation of a ‘lower high’ signifies buyers’ increasing willingness to pay higher prices over time. For instance, Boeing’s pattern exhibited rising bottoms, with prices escalating from $170 to $180 and then $190.

Observing Seller Behavior
Conversely, sellers in an ascending triangle maintain a horizontal resistance level, displaying patience in awaiting buyers. Boeing’s sellers have lingered around $190, indicating a reluctance to reduce their asking prices. This interplay between aggressive buyers and patient sellers lays the groundwork for a potential upward movement.
Contrasting Patterns for Price Projections
Earlier in the year, Boeing exhibited a ‘Descending Triangle,’ denoting aggressive selling and cautious buying. While sellers adjusted to lower prices, buyers remained steadfast near $200. This dynamic projected a bearish trend, which materialized as expected.
The reliability of ascending and descending triangles as predictive patterns is well-documented. The emergence of an ascending triangle in Boeing’s chart signals a likelihood of an upward price movement in the near future.
