Deciphering Wall Street’s Displeasure…
Today’s Consumer Price Index (CPI) reading brought a rare victory in the battle against inflation with the lowest figure since 2021.
The month-over-month CPI increase of 0.2%, meeting the Dow Jones forecast, resulted in a year-over-year rise of 2.5%, significantly lower than the previous month’s 2.9% surge.
However, core inflation led to some unease by rising 0.3% month-over-month, slightly above the predicted 0.2%. Yet, the year-over-year figure of 3.2% aligned with expectations.
The most notable boost came from housing-related expenses, where the shelter component of the CPI soared by 0.5% within the month and 5.2% year-over-year.
Stocks faced heavy selling pressure initially, but a recovery is underway, particularly noted by Nasdaq turning positive.
Today’s market focus appeared fixed on the unexpected rise in monthly core inflation, damping hopes of a large 50-basis-point rate cut next week.
Challenging Market History with a Silly Tantrum
The current market selloff, driven by the desire for a 50-basis-point cut, unveils a familiar theme to those versed in market history.
An analysis of past market performances suggests that a more prudent 25 basis points in rate cuts is favorable for investors.
Comparing the S&P’s 12-month and 24-month results post “slow rate cuts” versus “fast rate cuts” following a new rate-cutting phase paints a compelling picture favoring gradual adjustments.
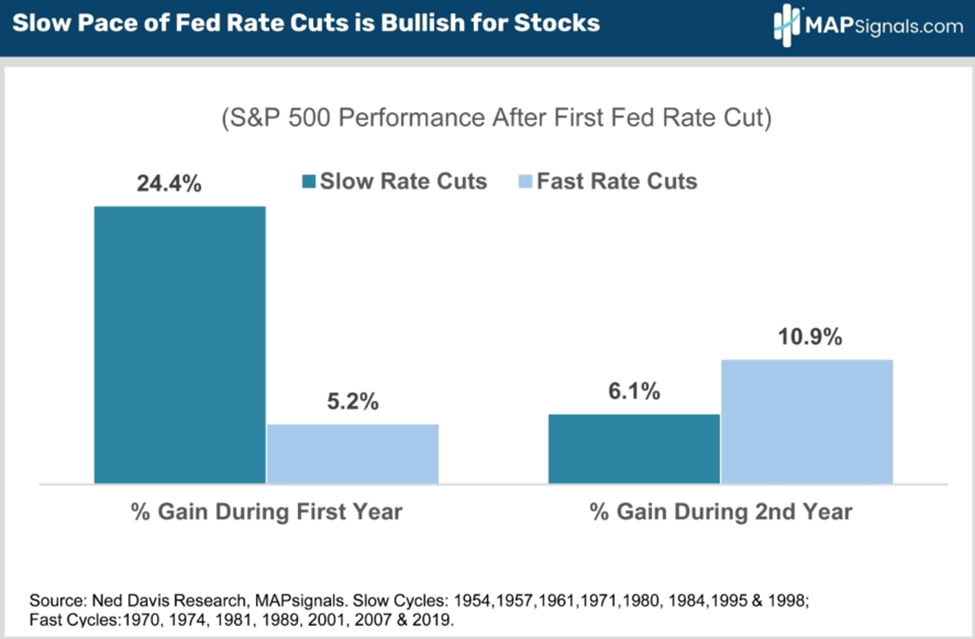
Source: MAPSignals / Lucas Downey
This strategic shift emphasizes a nuanced understanding of market actions rather than a myopic focus on immediate effects.
When compared, a 25 basis-point cut symbolizes a soft landing approach, while a 50-basis-point cut signals significant economic concerns.
Therefore, advocating for a modest rate cut seems prudent, especially to avoid any undue alarm over the economy’s status.
Despite Wall Street’s clamor, a measured approach remains the optimal choice.
Escaping the Market Quagmire through Focused Investments
Shifting gears, investing wisdom often hinges on predictable market formulas, assuming specific actions equate to financial success.
However, the fallibility of these assumptions highlights the undeniable truth that a stock’s value during your ownership period is the sole determinant of returns.
Therefore, the focus should center squarely on price movements rather than complex formulas or predictive models.
Adopting a strategy primarily anchored on price momentum enhances decision-making clarity amidst market uncertainties
Unlocking Investment Wisdom: Focus on Price Action
The Power of Price Action in Investment
If your stock is ascending in a well-defined trend, it’s a path to profit. Conversely, when a stock is plummeting or stagnating in a predictable pattern, it’s a clear signal to steer clear—ignoring all other indicators.
Price reflects reality.
Price stands as the ultimate arbiter of your financial future—deciding the fate of your retirement fund, your child’s education savings, or that dream lake house deposit.
So, why tether yourself to personal assumptions when you could purely focus on price movements?
Stage Analysis: A Strategic Approach
Our resident hypergrowth guru, Luke Lango, follows a methodology known as “Stage Analysis.” The concept is elegantly straightforward…
At any given moment, an asset either climbs, descends, or moves sideways, existing in one of four distinctive stages: 1) sideward motion at a bottom, 2) upward trend, 3) sideward motion at a peak, or 4) downward trend.
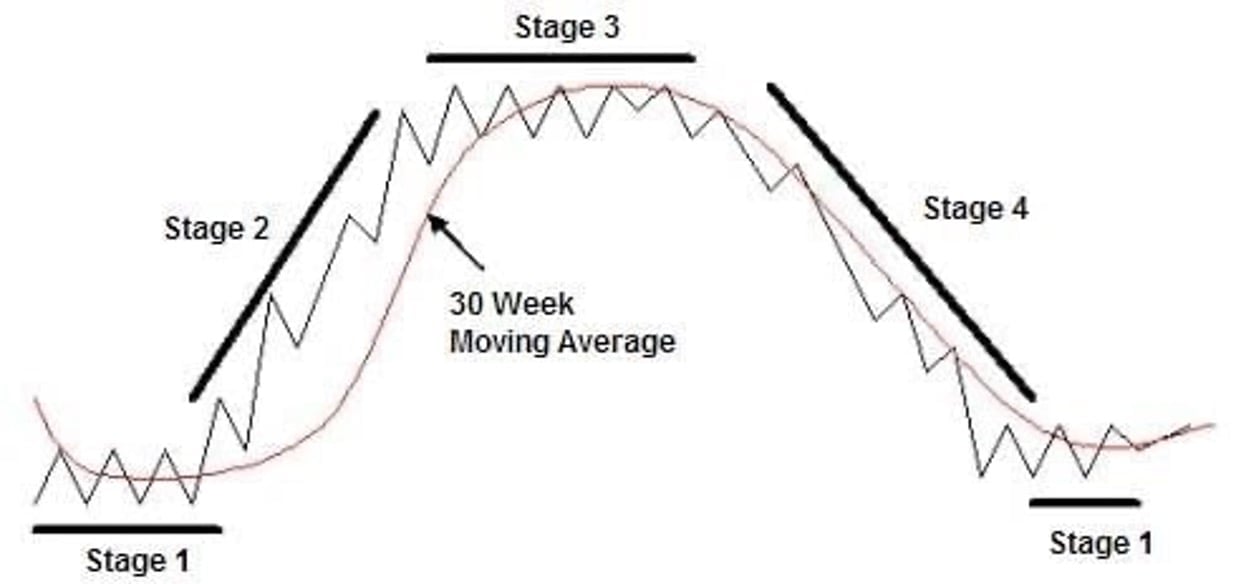
Stage analysis is the tool for determining a stock’s current stage and investing exclusively when it’s surging in Stage 2.
This approach places unwavering focus on price—the sole variable impacting your financial well-being.
According to Luke, “… The crux of your portfolio’s fate lies in whether the stocks you possess appreciate while in your possession.”
Imagine stumbling upon a ghastly company—its financials in disarray, incompetent management, and a dying sector.
But what if its shares broke out, poised to double from $5 to $10? Would those adverse traits matter then?
When the goal is wealth accumulation, these details fade in significance. All that counts is the stock’s upward trajectory during your ownership.
Embracing Price Action
This incessant focus on price liberates us from the shackles of future predictions or personal biases regarding market outcomes.
We merely decode a stock’s—or the market’s—”truth” as revealed by price action alone and respond judiciously.
While we’ve skimmed over numerous details today due to space constraints, including—discerning the precise stage, ideal timeframes for assessments, key indicators for each stage, safeguarding against misdiagnoses—Luke delves into these intricacies during tonight’s “Great Tech Reversal of 2024” event at 8 PM EST.
Expect an evening of insightful market analysis, portfolio strategy discussions, and deep dives into stage analysis.
Reserve your spot and join us at 8 PM EST for an enriching session.
Wishing you a splendid evening,
Jeff Remsburg